Development, Analysis And Research
by Andrew Johnstone
Amazon ELB – monitoring packet count and byte size with Amazon Cloudwatch and VPC flow logs
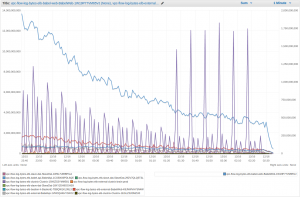
16 Dec 2015We recently exceeded the capacity for one of our Amazon ELBs in a 60 second period. One of the points of our debrief was to monitor the network from the ELB. Amazon doesn’t provide statistics from ELBs to Amazon cloudwatch. So I came up with the following:
- Using amazons apis capture the network interfaces with attachment.instance-owner-id for “amazon-elb”.
- For each network interface create a cloudwatch metric filter with the network interface.
Running the above in a lambda function with a scheduled event every 5 minutes will create the relevant filters and cloudwatch logs. This takes the overhead out of analysing the VPC flow logs.
Amazon ELBs rotate their servers and the attached ENIs will obviously rotate, so the second part is to identify whether the ENIs have been released and clean up.
Amazon ELBs will add/remove nodes to/from DNS, which should be faster than a 5 minute period (the current minimum for a scheduled task).
As such the time taken to start graphing new ENIs added to the ELBs will not be immediate. The above graphs should help us to infer an increase in network traffic through the ELB and to observe to set sensible alarms.
- Tags: Cloudwatch, ELB, ENI, Lambda, VPC, VPC Flow Logs
Comment Form
About this blog
I have been a developer for roughly 10 years and have worked with an extensive range of technologies. Whilst working for relatively small companies, I have worked with all aspects of the development life cycle, which has given me a broad and in-depth experience.
Archives
- September 2020
- December 2015
- June 2015
- May 2015
- October 2014
- April 2013
- October 2012
- September 2012
- July 2012
- January 2012
- December 2011
- June 2011
- February 2011
- January 2011
- December 2010
- July 2010
- May 2010
- April 2010
- January 2010
- December 2009
- October 2009
- June 2009
- February 2008
- July 2007
- June 2007
- April 2007
- December 2006
- October 2006
- August 2006
- July 2006
- April 2006
- March 2006
- February 2006
- January 2006
- December 2005
- November 2005
- October 2005
- August 2005
- July 2005
- June 2005
- March 2005
- June 2004
- Ozzy: Thanks Andy. This was useful (: [...]
- shahzaib: Nice post . I have a question regarding BGP. As you said, we'll need to advertise our route from mul [...]
- Steve: Hi there… sorry that this is old, but I’m trying to use your script to check for my u [...]
- John Cannon: Hey that was really needful. Thanks for sharing. I’ll surely be looking for more. [...]
- andrew.johnstone: In the example above this was in fact using spl_autoload_register. I’ve never debugged this proper [...]
- Istio EnvoyFilter to add x-request-id to all responses
- Amazon ELB – monitoring packet count and byte size with Amazon Cloudwatch and VPC flow logs
- SSL – Amazon ELB Certificates
- Automatically update Amazon ELB SSL Negotiation Policies
- Amazon Opsworks – Dependent on Monit
- Awk craziness: Processing log files
- Elastic Search Presentation
- Requests per second from Apache logs
- Hackday @ Everlution
- apt-get unattended / non-interactive installation
